
Module 6: Water Footprint and Wastewater Management in Aquaculture Production
Summary / Description Text
This module comprehensively addresses the concept of water footprint in aquaculture production and the management of wastewater in production processes. The water footprint is assessed through its blue, green and grey water components, enabling the measurement of pressure on freshwater resources. This allows for comparisons of water consumption differences and sustainability aspects between production systems (flow-through systems, pond culture, RAS, etc.). It also examines the impact of feed production on the water footprint, comparative research on different fish species, and sustainable feed sources for the future.
In the second part of the module, the components of wastewater originating from aquaculture (solid waste, dissolved nitrogen and phosphorus, antibiotics and chemical residues) and their potential effects on ecosystems (eutrophication, oxygen depletion, toxicological risks) are evaluated in detail. Physical, biological and physico-chemical treatment methods, along with environmentally friendly solutions such as aquaponic systems and constructed wetlands, are presented as alternative strategies for wastewater recovery and environmental sustainability.
Keywords: Water footprint, blue water, green water, grey water, wastewater management, aquaculture effluents, sustainable feed, RAS, eutrophication, biological treatment, constructed wetland, aquaponic system.
Learning Outcomes
By the end of this module, participants will be able to:
• Define the concept of water footprint and evaluate differences among aquaculture production systems.
• Analyze the impacts of feed production and feed components on the water footprint.
• Explain the main pollutant components in aquaculture wastewater and their environmental impacts.
• Compare physical, biological and physico-chemical methods used in wastewater treatment.
• Discuss the contributions of aquaponic systems and constructed wetlands to environmental sustainability.
• Interpret the relationship between water management and wastewater treatment in aquaculture and the Sustainable Development Goals (SDGs).
Presentation File
1.6. Water Footprint in Aquaculture Production
Today, the global population continues to increase predictably, and this demographic growth is exerting ever-greater pressure on essential natural resources such as agricultural land, freshwater resources, seafood, energy sources, and biodiversity. This situation has made the need for innovative, efficient, and long-term food production solutions—ones that not only ensure food security but also safeguard environmental sustainability, economic balance, and social well-being—inevitable. According to a report prepared by the United Nations, the world population is projected to reach 8.5 billion in 2030 and 9.7 billion in 2050 (United Nations Department of Economic and Social Affairs, Population Division, 2022).
Seafood, with its high protein content, is critically important not only for balanced nutrition but also for ensuring food security. Fisheries activities are particularly significant for coastal communities as they constitute a socioeconomically valuable source of livelihood and a means of local development. However, the rapid increase in the global population has driven rising food demand, which in turn promotes overfishing practices and threatens the balance of marine ecosystems. According to a report published by the FAO in 2023, overfishing led to a 58% decline in fish stocks in the Mediterranean and Black Sea region in 2021 (FAO, 2023). This situation poses a major risk both to the conservation of biodiversity and to the long-term availability of food supplies.
To mitigate this adverse situation and reduce pressure on aquatic ecosystems, aquaculture—also known as “fish farming”—emerges as a strategic alternative for sustainable food production. Through aquaculture practices carried out under controlled conditions, both the conservation of natural fish stocks is supported and regular, traceable production can be achieved throughout the year. By managing factors such as fish growth conditions, feed use, and water quality, aquaculture production systems can minimize the environmental impacts associated with fish farming. In this respect, aquaculture represents a modern production method that responds to the growing demand for food in line with environmental sustainability principles, contributing to economic development while playing a crucial role in achieving food security objectives.
The environmental, economic, and social benefits provided by aquaculture production systems are increasing global interest in fish farming day by day. This growth is largely driven by the incentives, support programs, and policies offered to aquaculture producers by many countries and international organizations. According to FAO data from 2024, aquaculture has experienced a remarkable increase since the 1970s; as of 2022, aquaculture accounted for 51% of total global aquatic food production (FAO, 2024). This development clearly highlights the critical importance of aquaculture in reducing dependence on traditional fishing practices and preventing the decline of fish stocks caused by overfishing.
Aquaculture systems represent a modern method that offers flexibility in production options—such as tanks, ponds, cage systems, and recirculating (closed-loop) aquaculture systems—depending on the producer’s preferences, the biological requirements of the species to be cultivated, and the conditions of the production environment. With technological advancements, these systems are continuously being improved to provide more efficient and sustainable production opportunities. Moreover, aquaculture stands out with its production potential that is not limited to coastal areas; through system designs that can be established at various scales in regions without direct access to seas or inland waters, it enables food production beyond coastal zones. In doing so, it creates employment opportunities in inland regions while contributing to the sustainable supply of food in these areas.
While aquaculture offers numerous advantages in terms of sustainability, it is also a production method that can entail environmental impacts. In particular, the potential pressures it may exert on both freshwater resources and aquatic ecosystems are issues that require careful consideration. According to research, approximately 201 km³ of freshwater was estimated to have been used globally for aquaculture activities in 2010, and this volume is projected to reach 469 km³ by 2050 in line with increasing production and demand (Mungkung et al., 2014). This calculation includes only the water consumption associated with the cultivation of plant-based raw materials such as soy used in fish feeds; when the direct water use from aquaculture operations themselves is also incorporated, the total water footprint is reported to increase even further (Vasquez-Mejia et al., 2023).
Water consumption levels in aquaculture vary significantly depending on the production system employed. For example, in a conventional flow-through trout farm, approximately 30 m³ of water is used to produce 1 kg of trout. In pond systems, this amount can increase to as much as 45 m³ (Bregnballe, 2015; Verdegem et al., 2006).
In contrast, recirculating aquaculture systems (RAS)—closed-loop systems in which water is treated through various purification processes and returned to the production system—have a markedly low level of water consumption. According to research, the amount of water required to produce 1 kg of fish in these systems varies between 0.016 m³ and 0.7 m³, depending on system intensity (Ahmed & Turchini, 2021). Keeping water use at a minimum makes recirculating aquaculture systems a critical alternative for sustainable aquaculture, particularly in regions where water resources are limited. Table 1 presents a comparative overview of water consumption levels across different aquaculture production systems.
Table 1. Water consumption per unit of fish production in aquaculture systems (Ahmed & Turchini, 2021).
| Aquaculture System | Water Consumption (m³ water/kg fish) | Reference |
| RAS | ||
| Marine fish production | 0.016 | Tal et al. (2009) |
| Fish production | 0.3–3 | Bregnballe (2015) |
| Production with advanced technology | <0.1 | Martins et al. (2010) |
| Catfish | 0.5 | Verdegem et al. (2006) |
| Eel | 0.7 | Verdegem et al. (2006) |
| Turbot | 1.4 | Verdegem et al. (2006) |
| Pond Culture | ||
| Intensive culture | 2.7 | Verdegem et al. (2006) |
| Extensive culture | 45 | Verdegem et al. (2006) |
| Flow-through System | ||
| Trout farming | 30 | Bregnballe (2015) |
Aquaculture production systems are classified as extensive, semi-intensive, or intensive depending on the amount of inputs such as feed, energy, and labor applied per unit area, as well as on production and stocking density (Ahmad et al., 2021). In intensive systems, production is continuously managed through practices such as feeding, aeration of water, and water quality control to support fish growth. In extensive systems, on the other hand, natural conditions predominate; fish grow on natural food sources without human intervention (Australian Government Department of Agriculture, Fisheries and Forestry, 2025). Semi-intensive systems combine both approaches, utilizing natural conditions along with supportive practices.
Water footprint assessment in aquaculture quantifies the amount of water consumed and polluted during the production process, providing a tangible means of evaluating the sector’s environmental impacts. Through this calculation, the pressure of aquaculture activities on freshwater resources can be measured, and the ecological sustainability of production processes can be assessed. Water footprint accounting offers a comprehensive analysis based on blue, green, and grey water components. This analysis not only contributes to optimizing water use at every stage of production but also enables the development of preventive strategies to reduce environmental impacts. Moreover, conducting water footprint analyses in the aquaculture sector supports the creation of water-efficiency-focused management policies in addition to assessing the current situation. In this respect, the water footprint is a key indicator that underpins strategic decisions for the conservation, improvement, and sustainable use of water resources.
The concept of the water footprint dates back to the early 2000s. It was first defined by Hoekstra and Mekonnen (2002) in a study estimating the water footprints of countries. In this study, the water footprint was defined as “the amount of water consumed and polluted during the production of goods and services throughout the entire supply chain” (Hoekstra & Mekonnen, 2002). The water footprint is a holistic accounting method composed of three components: blue water footprint, green water footprint, and grey water footprint, which together constitute the total water footprint. Water footprint assessment provides a comprehensive means of evaluating the total water use and environmental impacts of production processes.
The blue water footprint refers to the volume of surface and groundwater directly consumed in the production of a product (Dursun, 2019). In aquaculture, this includes source water used to fill ponds or tank water used to maintain circulation in recirculating systems. In aquaculture production systems, the blue water footprint is an important calculation that reveals the resource consumption within production processes.
The green water footprint refers to the portion of rainwater stored in the soil that is used during the agricultural production process (Lahlou et al., 2023). This water is absorbed by plants, providing the moisture necessary for their growth, and is naturally consumed without percolating into the groundwater. Although its direct effect in aquaculture is limited, the cultivation of agricultural products such as soybean meal and corn meal used in fish feeds involves rainwater consumption, which creates an indirect green water footprint. In aquaculture production systems, there is indirect green water consumption. The rainwater used in growing agricultural commodities such as soybeans or corn, which serve as raw materials for fish feeds, contributes to their green water footprint. Therefore, feed-related agricultural activities constitute the indirect component of the green water footprint in aquaculture.
The grey water footprint refers to the volume of freshwater required to assimilate the pollutant load generated during the production process so that water quality standards set by environmental regulations can be met (Dursun, 2019). In other words, it indicates how much clean water is needed to safely dilute and manage the pollution without harming the environment. In aquaculture, the grey water footprint arises particularly from pollution sources such as fish excreta, feed waste, antibiotic residues, or chemicals used in the system. The introduction of these substances into water deteriorates its natural quality, and the amount of water needed to dilute this pollution is calculated as the grey water footprint.
1.6.1. Scientific Studies on the Water Footprint of Aquaculture Production Systems
Since water is the primary resource in the cultivation of aquatic organisms in aquaculture production systems, calculating the direct and indirect water use as part of the water footprint is of great importance. This calculation not only contributes to assessing the environmental impacts of production processes but also serves as a guide for the sustainable management of water resources. In this context, there are various scientific studies addressing the blue, green, and grey water footprints generated in aquaculture production (Guzmán-Luna et al., 2021; Pahlow et al., 2015).
In the study conducted by Guzmán-Luna et al. (2021), the blue, green, and grey water footprints of one ton of tilapia produced in extensive, semi-intensive, and intensive production systems in Mexico were calculated (Guzmán-Luna et al., 2021). The production stages considered in the study include broodstock, fingerling production, grow-out, processing, and transportation. Production was carried out in three different modes: extensive, semi-intensive, and intensive. Within these systems, fish mortality rates and inputs such as fish feed, fertilizers, and hormones vary. Figure 1 shows the production stages considered in the study.
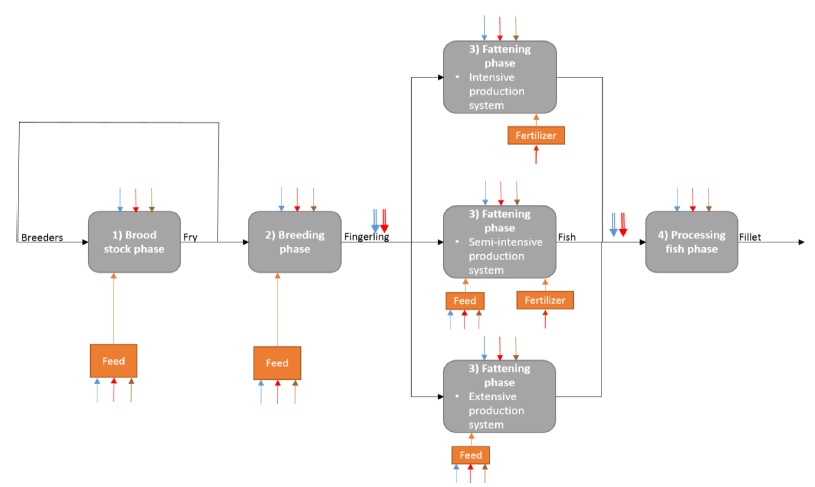
Figure 1. Aquaculture production stages considered in the water footprint assessment (Guzmán-Luna et al., 2021).
The first step in water footprint assessment is the calculation of the direct blue water footprint. Within this scope, the calculation is based on the water exchange within the system. In the study, the calculated blue water footprint included the freshwater directly sourced, evaporated, and used for transportation in the aquaculture production system. For example, in the calculation of the direct water footprint of semi-intensive and intensive systems where water is continuously exchanged, the following formula is used:
In the study, the green water footprint encompasses the water footprint generated during the production of feed used to nourish broodstock and juvenile fish during the hatchery and breeding stages. The water footprint resulting from feed consumption is calculated for each agricultural ingredient used in the feed composition. In the study conducted by Guzmán-Luna et al., the water footprint values of feed ingredients were determined by referencing the values reported by Mekonnen and Hoekstra (2010) (Mekonnen & Hoekstra, 2010).
Within the scope of the study, the calculated direct grey water footprint was determined by considering nitrogen pollution in wastewater generated during the broodstock, fingerling production, and grow-out stages, as well as chemical oxygen demand (COD) pollution in the processing stage. For each type of pollutant, the volume of dilution water required to meet the limit values specified in environmental legislation was calculated. In the formula, C_max represents the permitted maximum pollutant concentration (µg/m³), while C_natural denotes the natural pollutant concentration in the receiving water body. These data are obtained from national standards.
According to the results obtained from the study in which the water footprint of tilapia production was assessed, the blue water footprint of tilapia across all production systems was found to be higher than its green and grey water footprints. This result is expected since the blue water footprint covers the direct water consumption in production processes. Table 2 presents the water footprint values for the production of 1 ton of tilapia.
Table 2. Water footprint of 1 ton of tilapia production
| Tilapia Production System | Blue Water Footprint (m³/ton) | Green Water Footprint (m³/ton) | Grey Water Footprint (m³/ton) |
| Extensive | 927 | 5 | 398 |
| Semi-intensive | 2,909 | 7,827 | 1,873 |
| Intensive | 13,027 | 7,831 | 1,873 |
In another phase of the study conducted by Guzmán-Luna et al. (2021), the water footprint, carbon footprint, and land use values of tilapia produced in intensive aquaculture systems were compared with the footprints of industrially produced beef, poultry, and pork (Guzmán-Luna et al., 2021). According to the results obtained from the study, the production of tilapia from cradle to processing was found to result in higher blue water consumption (13,027 L/kg) and a higher grey water footprint (1,873 L/kg) compared to other animal-based foods.
In the study, the green water footprint of tilapia produced in intensive systems was calculated as 7,831 L/kg, which is very close to the green water footprint of beef (8,849 L/kg), but higher than the green water footprint values of poultry and pork (Guzmán-Luna et al., 2021). Table 3 presents the global average water footprint values of beef, poultry, and pork produced in industrial systems in Mexico compared with tilapia produced in intensive systems.
Table 3. Global average water footprint of red meat, white meat, and tilapia produced in intensive systems in Mexico (Mekonnen & Hoekstra, 2010; Guzmán-Luna et al., 2021).
| Animal Product / Water Footprint | Blue Water Footprint (L/kg) | Green Water Footprint (L/kg) | Grey Water Footprint (L/kg) | Total (L/kg) |
| Beef | 683 | 8,849 | 712 | 10,244 |
| Poultry | 210 | 2,337 | 325 | 2,872 |
| Pork | 487 | 4,050 | 687 | 5,224 |
| Tilapia | 13,027 | 7,831 | 1,873 | 22,731 |
Aquaculture plays an important role in meeting the sustainable food needs of the growing global population. However, the preparation of feeds used in this production process entails significant consumption of natural resources. Although traditional feed ingredients such as fishmeal and fish oil can be replaced with plant-based raw materials, this shift may increase water consumption and pollution loads associated with agricultural production, thereby exerting additional pressure on freshwater resources. In this regard, commercial feed production accounts for a significant share of the water footprint in aquaculture production systems. For this reason, commercial feed production is a major contributor to the water footprint of aquaculture systems. In the study conducted by Pahlow et al. (2015), the green, blue, and grey water footprints associated with the production of commercial feeds for cultured fish and shellfish were determined for the year 2008. The study calculated the feed-related water footprint for many fish species produced through aquaculture farming systems.
According to the results obtained from the study, in 2008 the average green, blue, and grey water footprints of major aquaculture species fed with commercial feeds were calculated as 1,629 m³/ton, 179 m³/ton, and 166 m³/ton, respectively. In total, the water footprint of commercial aquaculture feeds was estimated to range between 31,000,000,000 m³ and 35,000,000,000 m³ (Pahlow et al., 2015). The study also reported that the species contributing the most to the water footprint associated with commercial feed use were Nile tilapia, grass carp, whiteleg shrimp, common carp, and Atlantic salmon, and that these five species alone accounted for approximately 18,000,000,000 m³ of water consumption in 2008 (Pahlow et al., 2015). Table 4 presents the water footprint values of the species identified in the study as generating the highest water footprints.
Table 4. Water footprint values associated with feed consumption by fish species (Pahlow et al., 2015).
| Species | Green Water Footprint (million m³/ton) | Total Water Footprint (million m³/ton) |
| Nile Tilapia | 3,800 | 4,400 |
| Grass Carp | 3,000 | 4,000 |
| Whiteleg Shrimp | 2,800 | 3,500 |
| Common Carp | 2,700 | 3,400 |
| Atlantic Salmon | 2,300 | 2,800 |
The water footprint value of commercial feeds varies depending on the ingredients used in the feed composition. For example, in aquaculture of Indian carp, it was found that the use of large amounts of low-water-footprint ingredients such as rice bran results in a much lower feed-related water footprint compared to species whose feeds include soy (Biswas et al., 2006). Table 5 presents the water footprint values of different feed types used in carp production.
Table 5. Water footprint of different feed types used in carp production (Sun et al., 2011; Hu et al., 2014).
| Water Footprint Component | (Hu et al., 2014) | (Sun et al., 2011) |
| Blue Water Footprint | 222 m³/ton | 192 m³/ton |
| Green Water Footprint | 2,181 m³/ton | 2,172 m³/ton |
| Grey Water Footprint | 131 m³/ton | 212 m³/ton |
The results of this study indicate that in order for the aquaculture sector to grow sustainably, factors arising from feed production that may exert pressure on the environment must be taken into consideration. Research is being conducted on sustainable feed sources to minimize the environmental impacts associated with commercial feeds. In this context, fishmeal is often replaced with plant-based proteins. However, the inclusion of high amounts of soybean meal in fish feeds has been shown to cause diseases in fish metabolism (Fantatto et al., 2024). Therefore, the suitability of using insect species in fish feed formulations has been evaluated. In this regard, certain insect species such as Hermetia illucens, Tenebrio molitor, and Musca domestica have been identified as potential substitutes for fishmeal (Fantatto et al., 2024).
1.7. Wastewater Management in Aquaculture Production
1.7.1. Wastewater Sources and Characteristics
Aquaculture is a rapidly growing production method worldwide and plays a significant role in sustainable food supply. However, this growth exerts serious environmental pressures on aquatic ecosystems, particularly due to the wastewater generated during the production process. Along with feed waste, metabolic waste, and chemicals used, wastewater can lead to adverse effects in receiving environments such as oxygen depletion, eutrophication, and loss of biodiversity.
For this reason, it is of vital importance to examine in detail the sources, chemical and physical composition, environmental impacts, and effective treatment methods of wastewater generated in aquaculture production systems to ensure environmental sustainability and the conservation of resources. The sustainable management of aquaculture production systems can be achieved by controlling these wastewaters and adopting ecosystem-based approaches. Figure 2 presents a visual summary of the wastes generated in aquaculture production systems and their sources.
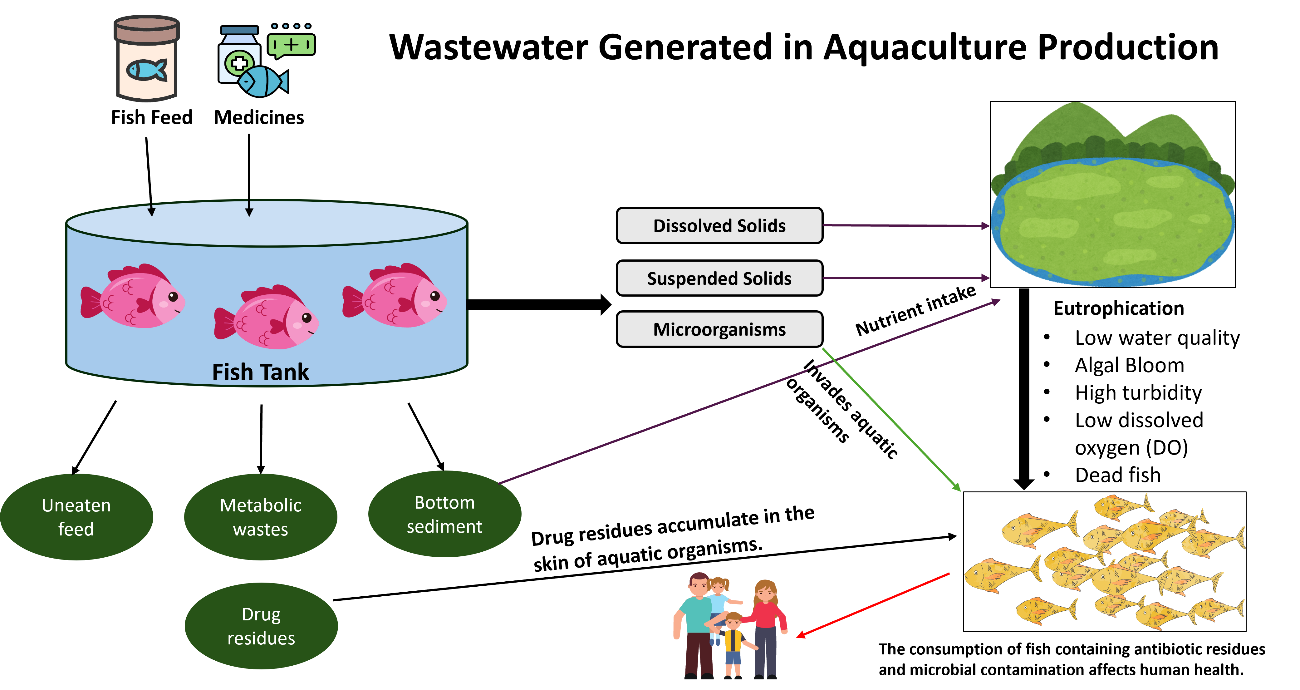
Figure 2. Aquaculture wastewater sources (Ojewole et al., 2022).
Since aquaculture production systems involve feed and medicinal inputs, they release into the environment uneaten feed, fish metabolic wastes, settled sediments, and substances contained in the medicines used for fish diseases as waste (Ojewole et al., 2024). In aquaculture production systems, wastes commonly consist of solid matter as well as dissolved nitrogen- and phosphorus-containing compounds (Silvanir et al., 2024). Particularly in pond-based aquaculture, fertilizers used to increase production efficiency contribute to the formation of nitrogen- and phosphorus-based wastewater (Liu et al., 2024). In addition to these wastes, residues of antibiotics, PCBs, disinfectants, and pesticides arising from chemicals and medicines used in production systems are among the pollutants that can be found in aquaculture wastewater (Liu et al., 2024). Table 6 summarizes the pollutants commonly found in the wastewater of aquaculture production systems and their environmental impacts.
Table 6. Common pollutants found in aquaculture wastewater (Silvanir et al., 2024).
| Waste Type | Sub-type | Source | Potential Environmental/Health Impacts |
| Solid wastes | Solid waste | Uneaten feed, feces, dead fish | Can cause gill clogging leading to fish mortality, induce stress in cultured fish, accumulate nitrogenous compounds, and reduce dissolved oxygen due to increased oxygen consumption. |
| Dissolved wastes | Nitrogen compounds: Ammonia | Fertilizers, feed, feces of cultured fish (by-product of protein metabolism), microbial decomposition of organic matter | Toxic to cultured fish; impairs fish health and causes stress. |
| Nitrogen compounds: Nitrite | Oxidation of ammonia to nitrite by bacteria | Toxic to cultured fish; causes “brown blood disease” due to increased methemoglobin/methemocyanin levels in blood. | |
| Nitrogen compounds: Nitrate | Oxidation of nitrite to nitrate by bacteria | May cause deformities and behavioral or even hormonal disturbances in some fish; can trigger secondary stress responses but is generally considered safe for most fish. | |
| Phosphorus compounds | Waste decomposition, uneaten feed, decaying plants, and fish feces | Leads to phosphorus accumulation and eutrophication; not directly toxic to cultured fish but harms the environment through algal blooms and dissolved oxygen depletion. |
When aquaculture wastewater is examined in terms of physical parameters, criteria such as turbidity, temperature, color, and suspended solids are at the forefront in terms of pollution (Yang et al., 2025). These parameters play a vital role in determining the environmental impact and in selecting the appropriate treatment methods.
The biological composition of aquaculture wastewater is characterized mainly by organic matter, predominantly measured through Biochemical Oxygen Demand (BOD) and Chemical Oxygen Demand (COD) (Yang et al., 2025). These parameters are important for determining the oxygen levels in the receiving environment.
The chemical content of aquaculture wastewater is predominantly composed of nitrogen and phosphorus. Due to feed additives, corrosion of equipment used in production systems, and external industrial discharges, the presence of heavy metals in aquaculture wastewater has also been reported (Yang et al., 2025). Additionally, microbial pollutants such as bacteria, viruses, and parasites may also be present in these systems (Yang et al., 2025). The composition of pollutants varies depending on the fish species being cultured. Table 7 presents the wastewater compositions of some commonly farmed species.
Table 7. Wastewater characterization of commonly farmed species (Ojewole et al., 2022).
| Species | pH | Phosphate | Nitrate | Nitrite | COD | TSS | References |
| Catfish | 7.9 | 0.91 mg/L | 0.83 mg/L | – | 758 mg/L | 45 mg/L | Igwegbe & Onukwuli, 2019 |
| Catfish | 6.68 | 2.5 mg/L | 8.5 mg/L | – | 108.7 mg/L | 0.7 mg/L | Omotade et al., 2019 |
| Catfish | 7.20 | 2.5 mg/L | 5.0 mg/L | 0.25 mg/L | – | 1,125 mg/L | Akinwole et al., 2016 |
| Shrimp | 8.05 ± 0.01 | 7.20 ± 0.03 mg/L | 3.47 ± 0.02 mg/L | 3.80 ± 0.03 mg/L | – | – | Khatoon et al., 2016 |
| Tilapia | 6.97 | 2.5 mg/L | 18.1 mg/L | 253 mg/L | – | Halfhide et al., 2014 | |
| Catfish, Seabass, Carp | 6.74 | 32.5 mg/L | 30.175 mg/L | 25 mg/L | 205 mg/L | 24.2 mg/L | Akinbile & Yusoff, 2012 |
| Catfish, Carp, Nile Tilapia | – | – | 20.0 – 42.9 mg/L | – | – | Famoofo |
Notes:
COD = Chemical Oxygen Demand
TSS = Total Suspended Solids
When the pollutants contained in all wastes generated in aquaculture production systems are discharged into receiving environments, they can lead to environmental problems such as toxicological effects, eutrophication, bacterial resistance, and soil degradation (Liu et al., 2024).
1.7.2. Wastewater Management and Treatment Methods
Aquaculture wastewater contains physical parameters such as pH, temperature, and suspended solids; chemical parameters such as nitrogen and phosphorus; and biological parameters such as BOD and COD, while also harboring various other pollutants including pathogens and antibiotics. Because these wastewaters contain many different types of pollutants, a wide range of methods can be employed for their treatment, including constructed wetlands, aquaponic systems, and physical, biological, and physico-chemical treatment methods.
The physico-chemical methods used in the treatment of aquaculture wastewater include advanced oxidation processes, adsorption, membrane technologies, and nanotechnology (Liu et al., 2024). The physical treatment methods preferred for aquaculture wastewater include sedimentation, screening, flotation, aeration, and filtration (Yang et al., 2025). Table 8 presents a comparison of the physical treatment methods used in aquaculture wastewater treatment.
Table 8. Comparison of physical treatment methods used in aquaculture wastewater (Yang et al., 2025).
| Physical Treatment Method | Function | Application | Effectiveness | Maintenance Requirement | Typical Use |
| Sedimentation | Settling of solid particles | Primary treatment step | High for large particles | Periodic sludge removal | General wastewater treatment |
| Screening | Removal of large particles | Initial removal of solid wastes | Variable depending on screen size | Regular cleaning of screens | Pre-filtration step |
| Flotation | Removal of fine suspended solids | Removal of oils/fats | High for oils | Monitoring air flow and surface skimmers | Wastewater with high oil content |
| Aeration | Increasing oxygen, removing gases | Water oxygenation | Essential for water quality/health | Equipment inspections | All aquaculture systems |
| Filtration | Removal of small particles | Secondary fine particle removal | High for small particles | Frequent cleaning and part replacement | Enhancement after pre-screening |
The biological treatment methods used in aquaculture wastewater treatment include activated sludge, trickling filters, constructed wetlands, anaerobic digestion, biofloc technology, and innovative methods employing microalgae (Yang et al., 2025). A comparison of these methods is presented in Table 9.
Table 9. Comparison of biological treatment methods used in aquaculture wastewater (Yang et al., 2025).
| Biological Treatment Method | Primary Function | Organism Used | Application | Effectiveness | Environmental Benefits |
| Activated Sludge System | Removal of organic pollutants | Aerobic microorganisms | General wastewater treatment | High effectiveness in BOD and COD removal | Reduces organic load |
| Trickling Filter | Biofilm-based organic degradation | Biofilm microorganisms | Small- and medium-scale facilities | Effective in BOD removal | Low energy, natural process |
| Constructed Wetlands | Natural filtration and nutrient uptake | Plants, microorganisms | Ecosystem mimicry, large-scale treatment | Effective in nutrient removal | Creates habitats, supports biodiversity |
| Anaerobic Digestion | Organic matter degradation, biogas production | Anaerobic microorganisms | Sludge and high-strength waste treatment | High effectiveness in organic waste removal | Energy generation, waste reduction |
| Microalgae Treatment | Nutrient removal, oxygen production | Microalgae | Treatment of nutrient-rich wastewaters | Variable depending on conditions | Low energy use, by-product utilization |
| Biofloc Technology | Nutrient recycling, improvement of water quality | Heterotrophic bacteria | Intensive aquaculture systems | Effective in nutrient recycling and water quality improvement | Reduces water exchange, increases feed efficiency |
According to the Ramsar Convention, wetlands are defined as “areas of marsh, fen, peatland or water, whether natural or artificial, permanent or temporary, with water that is static or flowing, fresh, brackish or salt, including areas of marine water the depth of which at low tide does not exceed six metres” (Ramsar Convention, 1975). Constructed wetlands, on the other hand, are systems created by placing porous materials such as stone, gravel, and sand inside impermeable clay layers or synthetic liners, where wastewater flow, retention time, and water levels are controlled (AATTUT, 2010).
Constructed wetlands installed at the outlet of aquaculture production facilities can be used for the treatment of aquaculture wastewater. In constructed wetlands, certain nutrients in the wastewater are taken up by plants, contributing to sustainable aquaculture practices (Yavuzcan Yıldız & Pulatsü, 2022). In constructed wetlands, the removal of TSS, dissolved organic matter, phosphorus, nitrogen, metals, and pathogens is achieved (Cooper et al., 1996). Table 10 summarizes the pollutant removal mechanisms carried out in constructed wetlands (Cooper et al., 1996).
Table 10. Pollutant removal mechanisms in constructed wetlands (Cooper et al., 1996).
| Wastewater Components | Removal Mechanisms |
| Suspended Solids | Sedimentation, Filtration |
| Dissolved Organic Matter | Aerobic, microbial degradation, Anaerobic microbial degradation |
| Phosphorus | Sorption, Uptake by plant roots |
| Nitrogen | Nitrification, Denitrification, Uptake by plant roots, Sorption, Ammonia volatilization (mostly in subsurface flow constructed wetlands) |
| Metals | Adsorption and cation Exchange, Complex formation, Precipitation, Uptake by plant roots, Microbial oxidation |
| Pathogens | Sedimentation, Filtration, Natural die-off, Antibiotic release from macrophyte roots |
Aquaponic systems, an innovative and environmentally friendly method of aquaculture wastewater treatment, are formed by combining hydroponics and recirculating aquaculture production systems (Yavuzcan Yıldız & Pulatsü, 2022). The system is based on the symbiotic relationship between fish and plants. The nutrients in the waste produced by fish naturally fertilize the plants, and in turn, the plants use these nutrients while acting as a filter to clean the water for the fish (Meyer et al., 2025). The filtered water is then returned to the fish tank, contributing to a healthy environment for the fish through the action of the plants. Aquaponic systems can be implemented at different scales depending on preference and purpose. There are home-scale hobby systems, commercial-scale systems, and systems designed for educational purposes. Types of aquaponic systems include five main variants: raft system, media-filled grow beds, nutrient film technique (NFT), wick system, and drip system (Kargın & Bilgüven, 2018).
Reference
Ahmad, A., Sheikh, A., Hasan, H., Othman, A., & Ismail, N. (2021). Aquaculture industry: supply and demand, best practices, effluent and its current issues and treatment technology. J. Environ. Manag., 287, 112271. doi:https://doi.org/10.1016/j.jenvman.2021.1
Ahmed, N., & Turchini, G. M. (2021). Recirculating aquaculture systems (RAS): Environmental solution and climate change adaptation. Journal of Cleaner Production, 297, 126604. https://doi.org/10.1016/J.JCLEPRO.2021.126604
Akinbile, C.O. Yusoff, M.S., 2012. Assessing water hyacinth (Eichhornia Crassopes) and lettuce (Pistia Stratiotes) effectiveness in aquaculture wastewater treatment, Int. J. Phytoremed. 14 (3) 201–211, https://doi.org/10.1080/15226514.2011.587482.
Akinwole, A., Dauda, A., Ololade, O., 2016. Growth Performance of African catfish (Clarias gariepinus) juveniles reared in wastewater treated with alum and moringa oleifera seed, J. Aquac. Res. Dev. 7 (12) https://doi.org/10.4172/2155-9546.1000460.
Atıksu Arıtma Tesisleri Teknik Usuller Tebliği (AATTUT, 2010), 20 Mart 2010, Resmî Gazete: 27527, Çevre, Şehircilik ve İklim Değişikliği Bakanlığı.
Biswas, G., Jena, J.K., Singh, S.K.,Muduli, H.K., 2006. Effect of feeding frequency on growth, survival and feed utilization in fingerlings of Catla catla (Hamilton), Labeo rohita (Hamilton) and Cirrhinus mrigala (Hamilton) in outdoor rearing systems. Aquac. Res. 37, 510–514. http://dx.doi.org/10.1111/j.1365-2109.2006.01457.x.
Bregnballe, J., 2015. A Guide to Recirculation Aquaculture: an Introduction to the New Environmentally Friendly and Highly Productive Closed Fish Farming Systems. FAO and EUROFISH International Organisation, Denmark.
Cao L, Wang W, Yang Y, Yang C, Yuan Z, Xiong S, Diana J (2007): Environmental Impact of Aquaculture and Countermeasures to Aquaculture Pollution in China. Env Sci Pollut Res 14 (7) 452–462
Dursun, N. (2019). Ardahan Üniversitesi Yenisey Kampüsü’nde Görev Yapan Personel ve Öğrenim Gören Öğrencilerin Su Ayak İzinin Belirlenmesi. Erzincan Üniversitesi Fen Bilimleri Enstitüsü Dergisi, 12(3), 1526-1536. https://doi.org/10.18185/erzifbed.587306
Famoofo, O.O. Adeniyi, I.F. 2020. Impact of effluent discharge from a medium-scale fish farm on the water quality of Odo-Owa stream near Ijebu-Ode, Ogun State, Southwest Nigeria, Appl. Water Sci. 10 (2) 68, https://doi.org/10.1007/s13201-020-1148-9.
Fantatto, R. R., Mota, J., Ligeiro, C., Vieira, I., Guilgur, L. G., Santos, M., & Murta, D. (2024). Exploring sustainable alternatives in aquaculture feeding: The role of insects. Aquaculture Reports, 37, 102228. https://doi.org/10.1016/J.AQREP.2024.102228
FAO. (2023). The State of Mediterranean and Black Sea Fisheries 2023-Special Edition. Roma: General Fisheries Comission for the Mediterranean. doi:https://doi.org/10.4060/cc8888en
FAO. (2024). The State of World Fisheries and Aquaculture 2024 – Blue Transformation in action. Rome: FAO. doi:https://doi.org/10.4060/cd0683en
Guzm´an-Luna, P., Gerbens-Leenes, P.W., Vaca-Jim´enez, S.D. (2021). The water, energy, and land footprint of tilapia aquaculture in mexico, a comparison of the footprints of fish and meat. Resources, Conservation & Recycling 165, 105224. https://doi.org/10.1016/j.resconrec.2020.105224
Halfhide T., Åkerstrøm, A. Lekang, O.I. Gislerød, H.R. Ergas, S.J., 2014. Production of algal biomass, chlorophyll, starch and lipids using aquaculture wastewater under axenic and non-axenic conditions, Algal. Res 6 152–159, https://doi.org/10.1016/j.algal.2014.10.009.
Hu, Y., Huang, Y., Feng, F., Zhong, L., Ai, Q., Xiao, T.,Wen, H., 2014. Effect of soybean meal replacement by cottonseed meal on growth, feed utilization and some blood physiological/ biochemical indices of juvenile black carp, Mylopharyngodon piceus. Aquac. Res. http://dx.doi.org/10.1111/are.12409.
Hoekstra, A.Y., Mekonnen, M.M., 2002. The water footprint of humanity. Proc. Natl. Acad. Sci. U.S.A. 109, 3232–3237. https://doi.org/10.1073/pnas.1109936109
Ibrahim, L.A. Shaghaleh, H. Abu-Hashim, M. Elsadek, E.A.. Hamoud, Y.A., 2023. Exploring the integration of rice and aquatic species: insights from global and national experiences, Water (Basel) 15 (15) 2750, https://doi.org/10.3390/w15152750.
Igwegbe, C.A., Onukwuli, O.D., 2019. Removal of total dissolved solids (TDS) from aquaculture wastewater by coagulation-flocculation process using Sesamum indicum extract: effect of operating parameters and coagulation-flocculation kinetics, Pharmaceut. Chem. J. 6 (4) 32–45.
Khatoon, H. , Banerjee, S., Syakir Syahiran, M. , Mat Noordin, N.B. Munafi Ambok Bolong, A. Endut, A., 2016. Re-use of aquaculture wastewater in cultivating microalgae as live feed for aquaculture organisms, Desalinat. Water Treat. 57 (60) 29295–29302.
Lahlou, F.Z., Mackey, H.R., Al-Ansari, T. 2023, Towards the development of an improved mass balance and water quality index based grey water footprint model, Environmental and Sustainability Indicators 18, 100236.
Liu, X., Wang, Y., Liu, H., Zhang,Y., Zhou, Q., Wen, X., Guo, W., Zhang Z., 2024, A systematic review on aquaculture wastewater: Pollutants, impacts, and treatment technology, Environmental Research, 262, 119793. https://doi.org/10.1016/j.envres.2024.119793
Martins, C.I.M., Eding, E.H., Verdegem, M.C.J., Heinsbroek, L.T.N., Schneider, O.,Blancheton, J.P., d’Orbcastel, E.R., Verreth, J.A.J., 2010. New developments in recirculating aquaculture systems in Europe: a perspective on environmental sustainability. Aquacult. Eng. 43, 83-93.
Mekonnen, M.M., Hoekstra, A.Y., 2010. The green, Blue and Grey Water Footprint of Farm Animals and Animal Products. UNESCO-IHE, Delft, the Netherlands. Value of Water Research Report Series No. 48.
Meyer, J., Weisstein, F., Kershaw, J., & Neves, K. (2025). A multi-method approach to assessing consumer acceptance of sustainable aquaponics. Aquaculture, 741764.
Mungkung , R., Phillips, M., Castine, S., Beveridge, M., Chaiyawannakarn, N., Nawapakpilai, S., Waite, R. (2014). Exploratory analysis of resource demand and the environmental footprint of future aquaculture development using Life Cycle Assessment. WorldFish, Penang, Malaysia. White Paper: 2014-31.
Omotade, I.F., Alatise, M.O., Olanrewaju, O.O., 2019. Recycling of aquaculture wastewater using charcoal based constructed wetlands, Int. J. Phytoremediat. 21 (5) 399–404.
Ojewole, A.E., Ndimele, P.E., Oladele, A.H., Saba, A.O., Oladipupo, I.O., Ojewole, C.O., Ositimehin, K.M., Oluwasanmi, A.S. , Kalejaye, O.S., 2024. Aquaculture wastewater management in Nigeria’s fisheries industry for sustainable aquaculture practices, Scientific African (25), e02283. https://doi.org/10.1016/j.sciaf.2024.e02283
Özellikle Su Kuşları Yaşama Ortamı Olarak Uluslararası Öneme Sahip Sulak Alanlar Hakkında Sözleşme (Ramsar Sözleşmesi), (1975).
Pahlow, M., van Oel, P.R., Mekonnen, M.M., Hoekstra, A.Y. 2015. Increasing pressure on freshwater resources due to terrestrial feed ingredients for aquaculture production. Science of the Total Environment 536, 847–857. https://doi.org/10.1016/j.scitotenv.2015.07.124
Silvanir, Foo, W. H., Chia, W. Y., Ende, S., Chia S.R., Chew, K.W., 2024. Nanomaterials in aquaculture disinfection, water quality monitoring and wastewater remediation, Journal of Environmental Chemical Engineering 12, 113947. https://doi.org/10.1016/j.jece.2024.113947
Sun, S., Ye, J., Chen, J., Wang, Y., Chen, L., 2011. Effect of dietary fish oil replacement by rapeseed oil on the growth, fatty acid composition and serum non-specific immunity response of fingerling black carp,Mylopharyngodon piceus. Aquac. Nutr. 17, 441–450. http://dx.doi.org/10.1111/j.1365-2095.2010.00822.x.
Tal, Y., Schreier, H.J., Sowers, K.R., Stubblefield, J.D., Place, A.R., Zohar, Y., 2009. Environmentally sustainable land-based marine aquaculture. Aquaculture 286, 28-35.
United Nations Department of Economic and Social Affairs, Population Division. (2022). World Population Prospects 2022: Summary of Results. UN DESA/POP/2022/TR/NO. 3.
URL-1 Australian Government Department Of Agriculture Fisheries and Forestry. (2025,Haziran 20). Agriculture and land. https://www.agriculture.gov.au/
Vasquez-Mejia, C.M., Shrivastava, S., Gudjonsdottir, M., Manzardo, A., Ogmundarson O. (2023). Current status and future research needs on the quantitative water use of finfish aquaculture using Life Cycle Assessment: A systematic literature review. Journal of Cleaner Production, 425, 139009. https://doi.org/10.1016/j.jclepro.2023.139009
Verdegem, M.C.J., Bosma, R.H., Verreth, J.A.J., 2006. Reducing water use for animal production through aquaculture. Int. J. Water Resour. Dev. 22, 101-113.
Yang, H., Tan, T., Du, X., Feng, Q., Liu, Y., Tang, Y., Bai, G., Liu, Z., Xia, S., Song , S., Quintana, M., Zhou, Q., Wu, Z., Zhang, Y., 2025. Advancements in freshwater aquaculture wastewater management: A comprehensive review Aquaculture 594, 741346. https://doi.org/10.1016/j.aquaculture.2024.741346
Yavuzcan Yıldız, H., & Pulatsü, S. (2022). Towards zero waste: sustainable waste management in aquaculture. Ege Journal of Fisheries and Aquatic Sciences, 39(4), 341-348. DOI: 10.12714/egejfas.39.4.11